Adversarial Attacks on a YOLOv8 Aircraft Detector
A study of white-box and black-box attacks on aerial imagery — and a sharp threshold that tells defenders exactly what to look for.
Background
An adversarial example is a small, deliberate change to an input that makes a model give a different answer.
Formally, given a clean input x and a model f, the attacker looks for a perturbation δ small enough that ‖δ‖ ≤ ε and yet f(x + δ) ≠ f(x). The notion of “small” depends on the distance metric.
L∞ bounds the largest per-pixel change: every pixel moves by a tiny amount, but no pixel moves more. This is the budget used by FGSM, our white-box attack. L0 bounds the number of pixels changed: only a few pixels move, but each can change by anything. This is the budget used by patch attacks — our black-box approach. Both can defeat the same model. They look completely different.
Setup & Baseline
Our target is a YOLOv8 detector fine-tuned on aerial imagery with twenty aircraft classes (A1–A20; the original dataset uses anonymous labels and we keep them). The fine-tuned weights live in best.pt and are treated as a fixed target throughout the experiments.
The test set contains seven 640×640 aerial images, test2 through test8. They span a real range of difficulty — from a single clean detection at 0.49 confidence to five strong detections at 0.96.
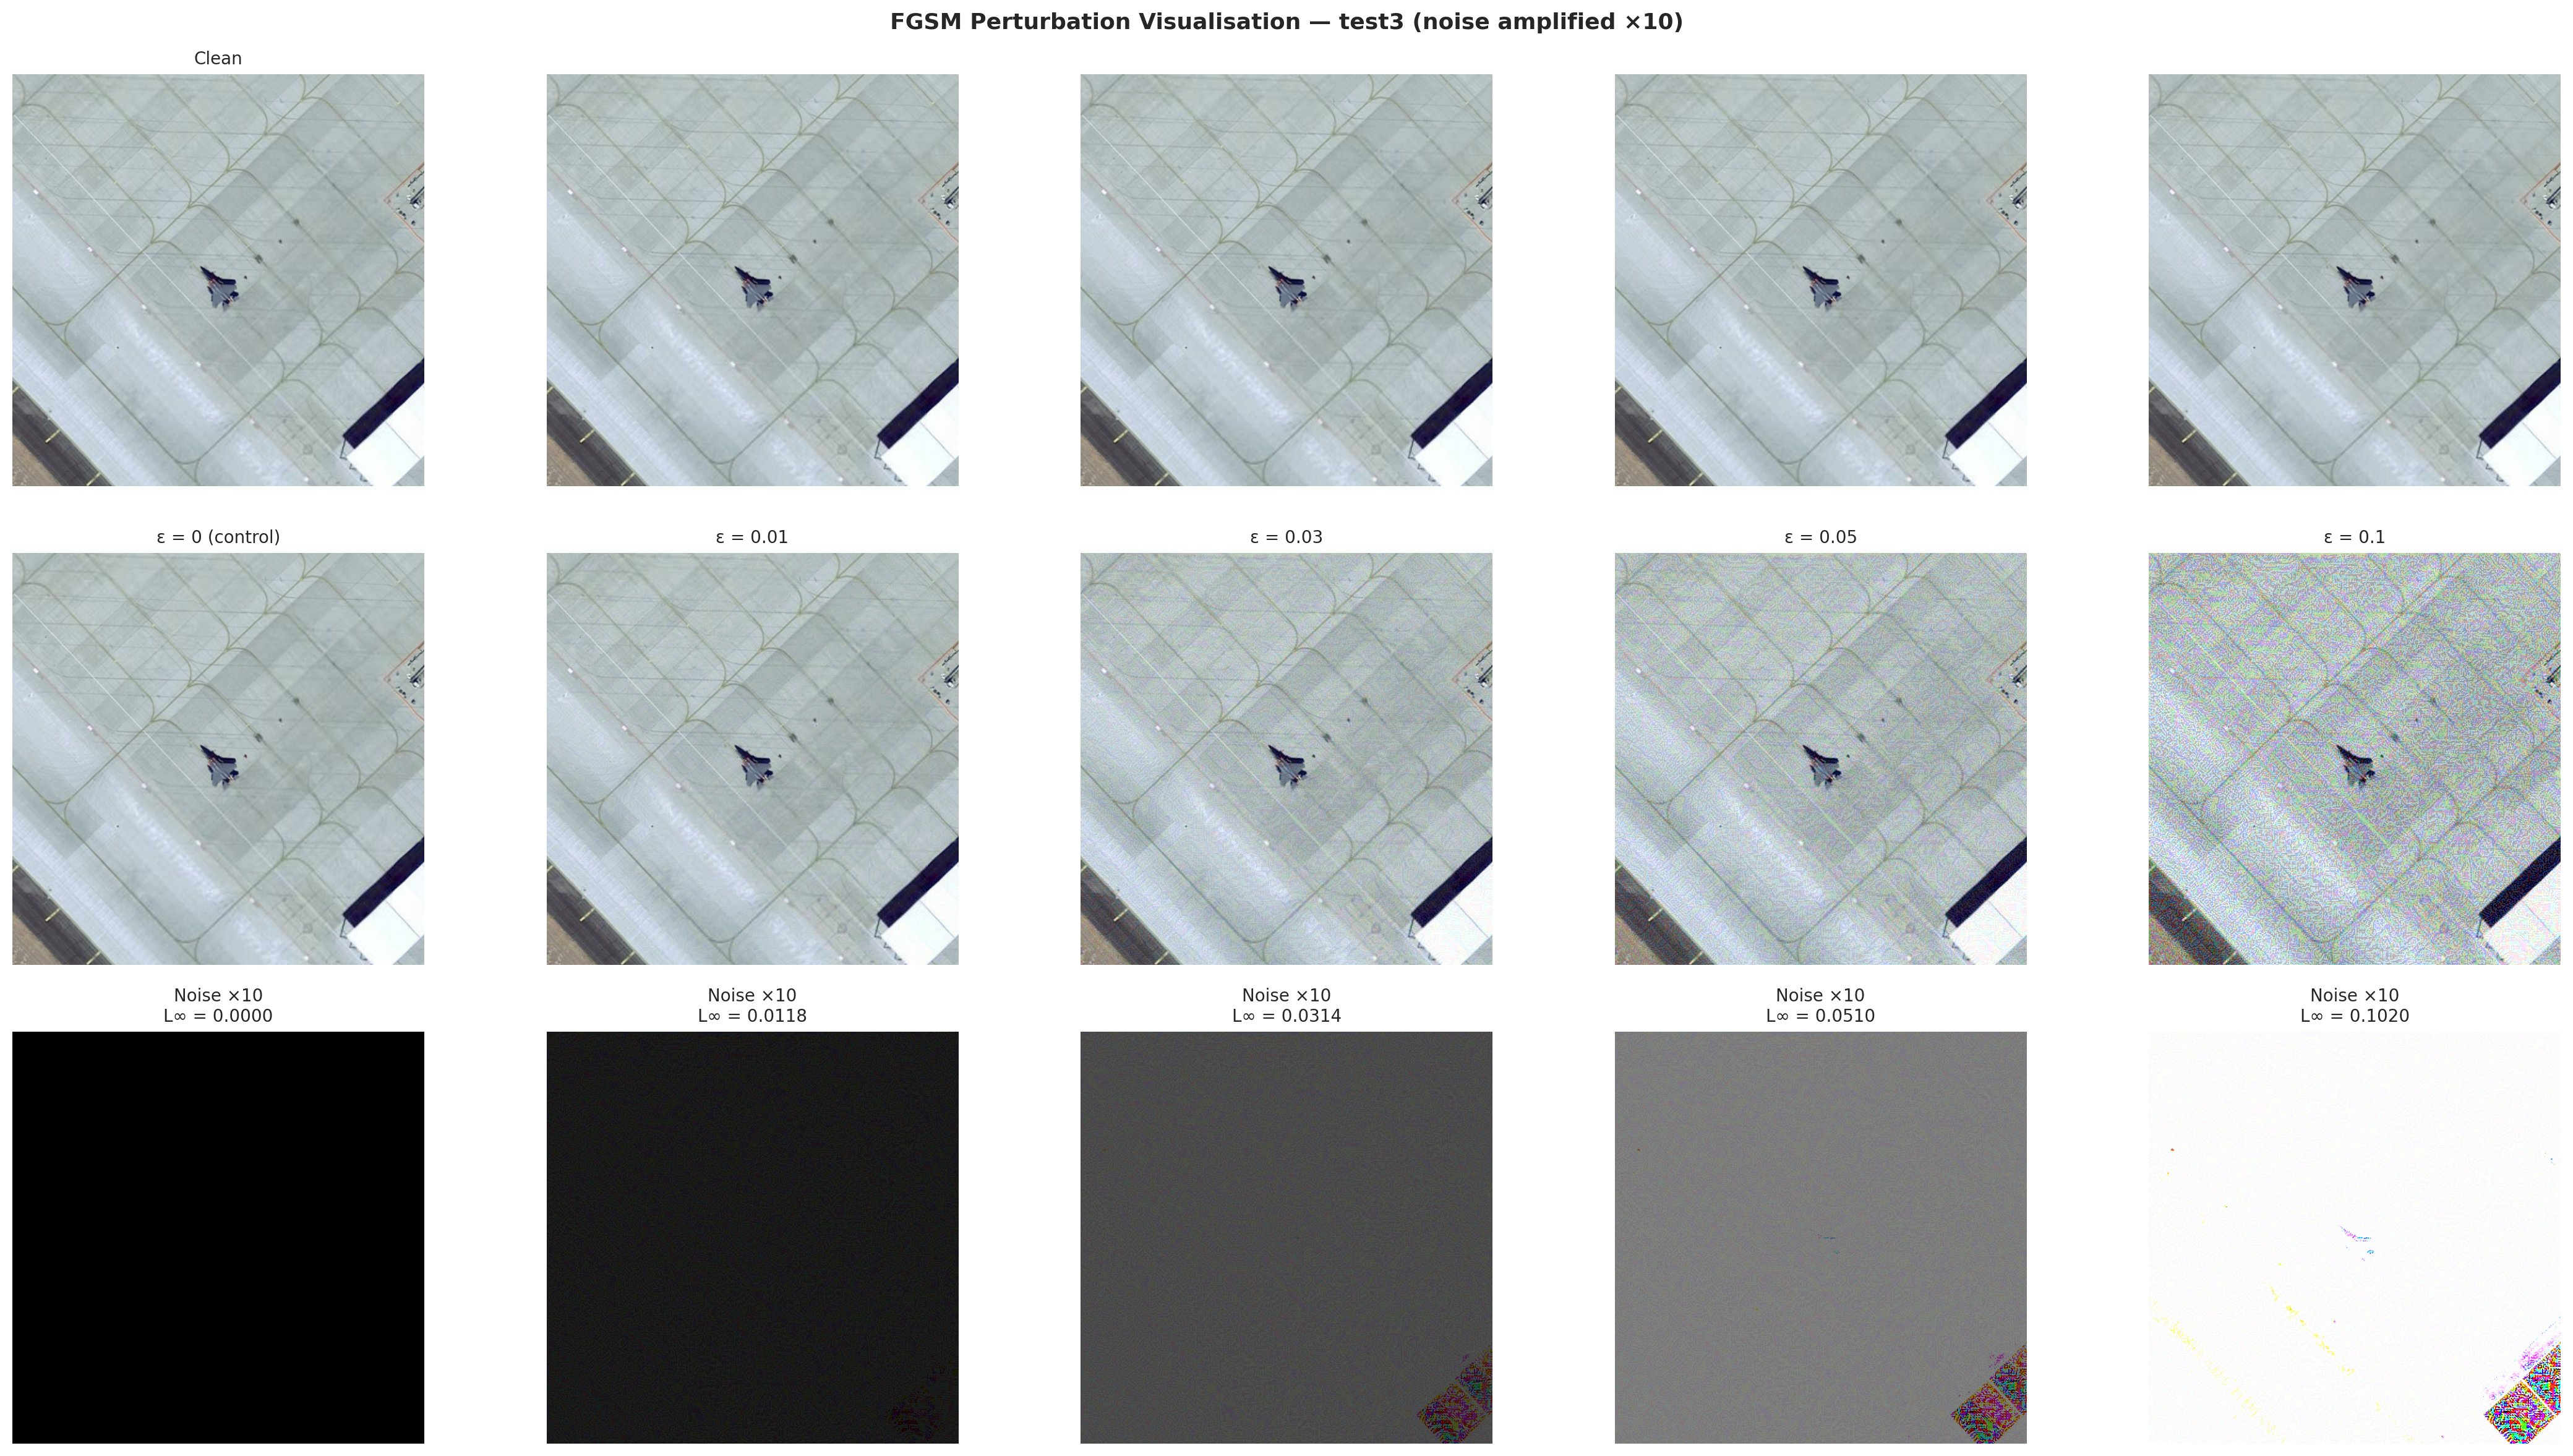
Three things to note from the baseline. test2 is the weakest case — four boxes hovering near the threshold. test3 is the cleanest — a single high-confidence detection used as our case study image. test7 is the strongest — five very confident detections of the same class. This range matters: it lets us see whether attacks behave differently against weak and strong baselines.
White-Box: FGSM
The simplest white-box attack. One step of gradient ascent. Every pixel changes by exactly ± ε. And it works.
FGSM (Goodfellow et al., 2014) is a one-step attack: the adversarial image is x′ = x + ε · sign(∇xL(θ, x, y)). Because YOLO doesn't produce a single scalar loss at inference, we use a surrogate — the squared L2norm of all detection output tensors. Pushing this surrogate up disrupts the detection head's activations.
We swept ε across {0.0, 0.01, 0.03, 0.05, 0.10} on all seven images — 35 attacks. For each one we recorded the surviving detections, the maximum and mean confidence, the retention rate, and a flag for full suppression.
The headline is on the suppression-rate tab: at ε = 0.10, 85.7% of images are fully blank. Six of seven end with zero detections. The mean max-confidence drops from 0.84 on clean inputs to 0.28 at ε = 0.10. Mean retention drops to 0.05. The attack works.
The detection-count tab hides a subtlety: at ε = 0.01 the count rises. That's not a bug. The activation-amplification surrogate inflates the detection head broadly, which spawns spurious low-confidence boxes. At ε = 0.01, test3 jumps from 1 to 5 detections, test5 from 4 to 7, test8 from 3 to 6. By ε = 0.05 everything has collapsed. Lesson: count alone is misleading at small ε.
The retention heatmap below tells the per-image story. Two images stand out: test6 falls at the smallest ε we tested — its baseline confidence (0.71) was the lowest among multi-detection images. test8 is the most resistant, holding one detection even at ε = 0.10. The pattern is clear: clean-image confidence margin predicts adversarial fragility.
Black-Box: DE Patches
The harder problem. No gradients, no weights — only an API. Eight patches, half a percent of the image. Fully successful.
In the black-box setting the attacker has no internal access. They send images, they read detections back. Random pixel search is hopeless: 256³ ≈ 1.7×10⁷ colour choices per pixel, 10²⁰⁰ configurations for a few dozen pixels, and YOLO's first conv layer smooths single-pixel noise away anyway.
We fix this with two moves. First, replace random search with Differential Evolution(Storn & Price, 1997) — a population-based optimiser that does not need gradients. Second, use coloured square patchesinstead of single pixels: a 16×16 patch produces a coherent low-frequency signal that survives YOLO's pooling.
Each patch is 5 numbers: top-left (x, y) and colour (r, g, b). With 8 patches the search vector is 40-dimensional. The total perturbation area is 0.500% of the image.
| Image | Attack | Base n | Adv n | Top conf | Adv conf | Queries |
|---|---|---|---|---|---|---|
| test2 | Conf. reduction | 4 | 0 | 0.493 | 0 | 2,048 |
| test2 | Suppression | 4 | 0 | 0.493 | 0 | 4,096 |
| test4 | Conf. reduction | 2 | 1 | 0.951 | 0.251 | 1,024 |
| test4 | Suppression | 2 | 0 | 0.951 | 0 | 3,584 |
The Patch-Size Threshold
The most original finding. Below 16 pixels the model is safe. Above, it isn't. The transition is sharp, not gradual.
Why 16×16 patches in the main experiment? Because we ran a sweep first. Same budget, same images, same number of patches — only the side length varied, from 8 to 24 pixels.
Three observations matter.
At k = 12 the optimiser plateaus around 0.27 even with the full DE budget. At k = 16 both attacks break through within a few generations. Not a slope — a step.
Confidence reduction and suppression are different objectives. Both fail at k = 12, both succeed at k = 16. The threshold is a property of the model, not the attack.
At k = 8, DE consumed 8,192 queries and failed. At k = 16, DE crossed the threshold in 2,048 queries — one quarter as many — and stopped early. The bottleneck is in the encoding, not the search.
Any input filter that flags rectangles bigger than ~0.3% of the image area will block this entire family of attacks — regardless of how clever the attacker's optimiser.
Comparison
The two attacks defeat the same model in very different ways.
| FGSM (white-box) | DE patches (black-box) | |
|---|---|---|
| Knowledge | Full model + gradients | Query-only |
| Budget | Every pixel, ≤ ε | 0.500% pixels, any colour |
| Visibility | Almost imperceptible | Patches clearly visible |
| Cost / attack | 1 fwd + 1 bwd pass | ~1,000–4,000 queries |
| Time / attack | Fraction of a second | ~1 minute on GPU |
| Success | 85.7% suppression | 4 / 4 tested cases |
| Defence | Adversarial training | Patch detection / filtering |
The asymmetry that matters most is cost. Black-box is roughly three orders of magnitude more expensive than white-box in queries, four in wall-clock time. That's the protective value of restricting attacker knowledge. A model behind a query-only API is meaningfully harder to attack than one whose weights have been distributed.
The asymmetry that matters next is visibility. FGSM can be defended only at the model level — adversarial training, smoothing. Patches can be defended at the input level — simple image-statistics filters can flag rectangular saturated regions. Different attacks, different countermeasures.
Discussion
The model is fragile in both threat models. Imperceptible noise reaches 85.7% suppression. Visible patches over 0.500% of the image reach 100% on every tested case.
The threshold is the most useful number
If we had to hand a defender a single number, it wouldn't be the suppression rate — they already suspected the attacker wins. It would be the patch-size threshold. That tells them exactly what to constrain: anything below 0.3% of the image is fine, anything bigger is suspicious.
Why count alone is misleading
At ε = 0.01, FGSM increases the detection count on five of seven test images because its surrogate loss inflates the detection head broadly. Anyone reporting only count would call small-ε FGSM a failure. It is not. Mean max-confidence and full-suppression rate, both monotone in ε, give the honest picture. We recommend reporting both.
For deployment
White-box attack cost is essentially zero. Removing this option raises the attacker's cost by 10³–10⁴×. Highest-impact thing you can do.
Reject any image with large saturated rectangular regions. The patch-size threshold gives a clear specification for “large”.
Limitations
- 01Test-set size. Seven images. Enough to demonstrate the phenomena, not enough for tight intervals.
- 02Black-box scope. Two images in the main experiment. Picked to span the difficulty range, but a full seven-image evaluation would be tighter.
- 03FGSM is single-step. PGD and AutoAttack are stronger at higher cost. Our axis was white-box vs black-box, not single-step vs iterative.
- 04No physical robustness. Digital domain only. JPEG, lighting, viewpoint changes all degrade adversarial perturbations. EoT-hardened patches are out of scope.
Team & Resources
This work was completed for the Computer and Network Security course at the National School of Artificial Intelligence (ENSIA), Algiers, in May 2026.
References
- Szegedy, C., et al. (2013). Intriguing properties of neural networks. arXiv:1312.6199.
- Goodfellow, I., Shlens, J., & Szegedy, C. (2014). Explaining and harnessing adversarial examples. ICLR 2015.
- Su, J., Vargas, D. V., & Sakurai, K. (2019). One pixel attack for fooling deep neural networks. IEEE Trans. Evolutionary Computation, 23(5), 828–841.
- Storn, R., & Price, K. (1997). Differential evolution — a simple and efficient heuristic for global optimization. J. Global Optimization, 11(4), 341–359.
- Jocher, G., Chaurasia, A., & Qiu, J. (2023). Ultralytics YOLOv8. github.com/ultralytics/ultralytics.